A food cost percentage calculated from missing ingredients or mismatched sales can hide losses on a busy menu. The formula is food ingredient cost ÷ matching food sales × 100: use one portion’s ingredient cost and selling amount for a dish, or inventory-based food usage and food sales from the same period for the operation.
Calculate food cost percentage at the scope of the decision you need to make. A recipe percentage helps cost a portion; a period percentage helps reconcile stock consumption with sales. Menu engineering then adds the food contribution left per sale and the number of portions sold, so a low percentage does not automatically win a place on the menu. Start with current ingredient costs, usable yields and a consistent sales basis. This guide provides assumed calculations for each scope, a menu comparison and a physical yield check. All example amounts are hypothetical inputs, and none is a price from a real restaurant or a recommended industry target.
Which inputs belong in food cost percentage?
Use ingredient costs and food sales with matching boundaries. This article treats packaging, labor and channel fees as separate operating inputs so the ingredient ratio stays comparable.
| Input or item | Typical value or source | Why it matters |
|---|---|---|
| Ingredient purchase cost | Your current invoice and purchase unit | A case cost must be converted before costing a portion |
| Usable recipe yield | Weighed usable output after the recipe’s preparation steps | Purchase weight may differ from portionable weight |
| Portion recipe | Ingredient quantities, including sauce, oil and garnish | Omissions understate theoretical food cost |
| Net food sales | Your food sales report, after relevant discounts/refunds and excluding sales tax | Keep non-food receipts and deductions from platform payouts out of the denominator |
| Opening and closing food inventory | Counts valued consistently at the period boundaries | Purchases alone do not show food used |
| Units sold | Item counts from the same category and review period | Supports sales weighting and menu decisions |
| Packaging, labor and channel charges | Separate operating records | Needed after food contribution to evaluate what the order leaves |
For a discounted item, use the net food selling amount on the same basis as the sales report. Keep paid-item counts, comps, refunds and recorded waste distinguishable when reconciling usage.
How do you calculate the percentage for one dish?
Add the ingredients in a complete portion, divide by that portion’s selling amount, and multiply by 100. The BC Cook Articulation Committee’s menu-engineering chapter defines the portion-cost ratio and explains that recipe components and yield affect portion cost. (The Principles of Menu Engineering, accessed October 19, 2026.)
Item food cost percentage = portion ingredient cost ÷ net food selling amount × 100
Worked example — assumptions: Assume the following costs are already converted to the usable quantities in a complete portion. Assume a $14.00 net food selling amount, with no discount or refund. All amounts are hypothetical dollars.
| Ingredient group | Assumed portion cost |
|---|---|
| Protein | $2.40 |
| Starch | $0.90 |
| Vegetables | $0.60 |
| Sauce, oil and garnish | $0.30 |
| Total ingredients | $4.20 |
Food cost percentage = ($2.40 + $0.90 + $0.60 + $0.30) ÷ $14.00 × 100 = 30%.
The corresponding food contribution = $14.00 − $4.20 = $9.80, before labor, packaging, channel charges and other operating costs. The assumed 30% is an arithmetic result, not evidence that the dish is profitable.
Cost a prepared sauce from its batch ingredients and usable output before assigning the portion amount. Convert purchase units once, preserve the recipe’s units, and recost when the invoice or yield changes.
How do you calculate actual food cost for a period?
Reconcile opening stock, purchases and closing stock before dividing by food sales. AccountingCoach explains the periodic inventory identity as beginning inventory plus net purchases and freight-in, less ending inventory. (Inventory and Cost of Goods Sold, accessed October 19, 2026.)
For a simplified restaurant food-usage reconciliation:
Food used = opening food inventory + delivered net food purchases − closing food inventory
Actual food cost percentage = food used ÷ net food sales for that period × 100
Here, delivered net purchases already include the relevant delivery cost and supplier credits. Adjust separately for transfers between locations, returns or other recorded movements if they are outside those figures. Count and value prepared stock consistently at both boundaries. The simplified usage total includes depletion from waste or unrecorded use; it is not proof that every ingredient was sold.
Separate worked example — assumptions: Assume opening food stock of $1,200, delivered net food purchases of $900, closing food stock of $1,100, and net food sales of $3,000. Assume a common period, consistent stock valuation and no net transfers or other adjustments.
Food used = $1,200 + $900 − $1,100 = $1,000; actual food cost percentage = $1,000 ÷ $3,000 × 100 ≈ 33.3%.
To compare actual with theoretical cost, multiply each recipe’s current portion cost by its paid portions sold, then sum the results. Record comps and other authorized consumption alongside that total. Assume, additionally, that the same period’s recipes predict $900 of food use for those $3,000 sales, with no comps or other authorized consumption. The theoretical percentage is 30%, leaving an unexplained $100, or about 3.3 percentage points, against the actual result. Check counts, units, invoice timing, portioning and waste records before assigning a cause. This period example is independent of the menu example below.
How does a menu use the percentage?
Use it alongside food contribution and demand within a comparable menu category. The BC Cook Articulation Committee defines food contribution as selling price less food cost and compares it with sales volume; it cautions that different menu categories have different contribution characteristics. (The Principles of Menu Engineering, accessed October 19, 2026.)
Food contribution per sale = net food selling amount − portion ingredient cost
Assumptions for this comparison: Items A and B are hypothetical main dishes in the same category and period. A uses the portion example above. Assume B has a $6.40 ingredient cost and $18.00 net selling amount. Assume 100 paid sales of A and 50 of B, without discounts or refunds. Labor and channel costs have not been deducted.
| Item | Assumed ingredient cost / net selling amount | Food cost percentage | Food contribution per sale / period | Dominant Failure Mode & Prevention |
|---|---|---|---|---|
| A; 100 assumed sales | $4.20 / $14.00 | 30.0% | $9.80 / $980 | Portion drift can erase the expected contribution; weigh usable portions and retain the recipe specification |
| B; 50 assumed sales | $6.40 / $18.00 | 35.6% | $11.60 / $580 | Promoting it only for its larger contribution per sale can overlook demand or service effort; check counts and prep burden before changing placement |
B leaves more food contribution on each sale despite its higher food cost percentage. A supplies more total food contribution in the assumed sales mix. Neither result alone establishes net profit.
Calculate the blend from money totals rather than averaging the two percentages:
Blended theoretical food cost percentage = [(100 × $4.20) + (50 × $6.40)] ÷ [(100 × $14.00) + (50 × $18.00)] × 100 = $740 ÷ $2,300 × 100 ≈ 32.2%.
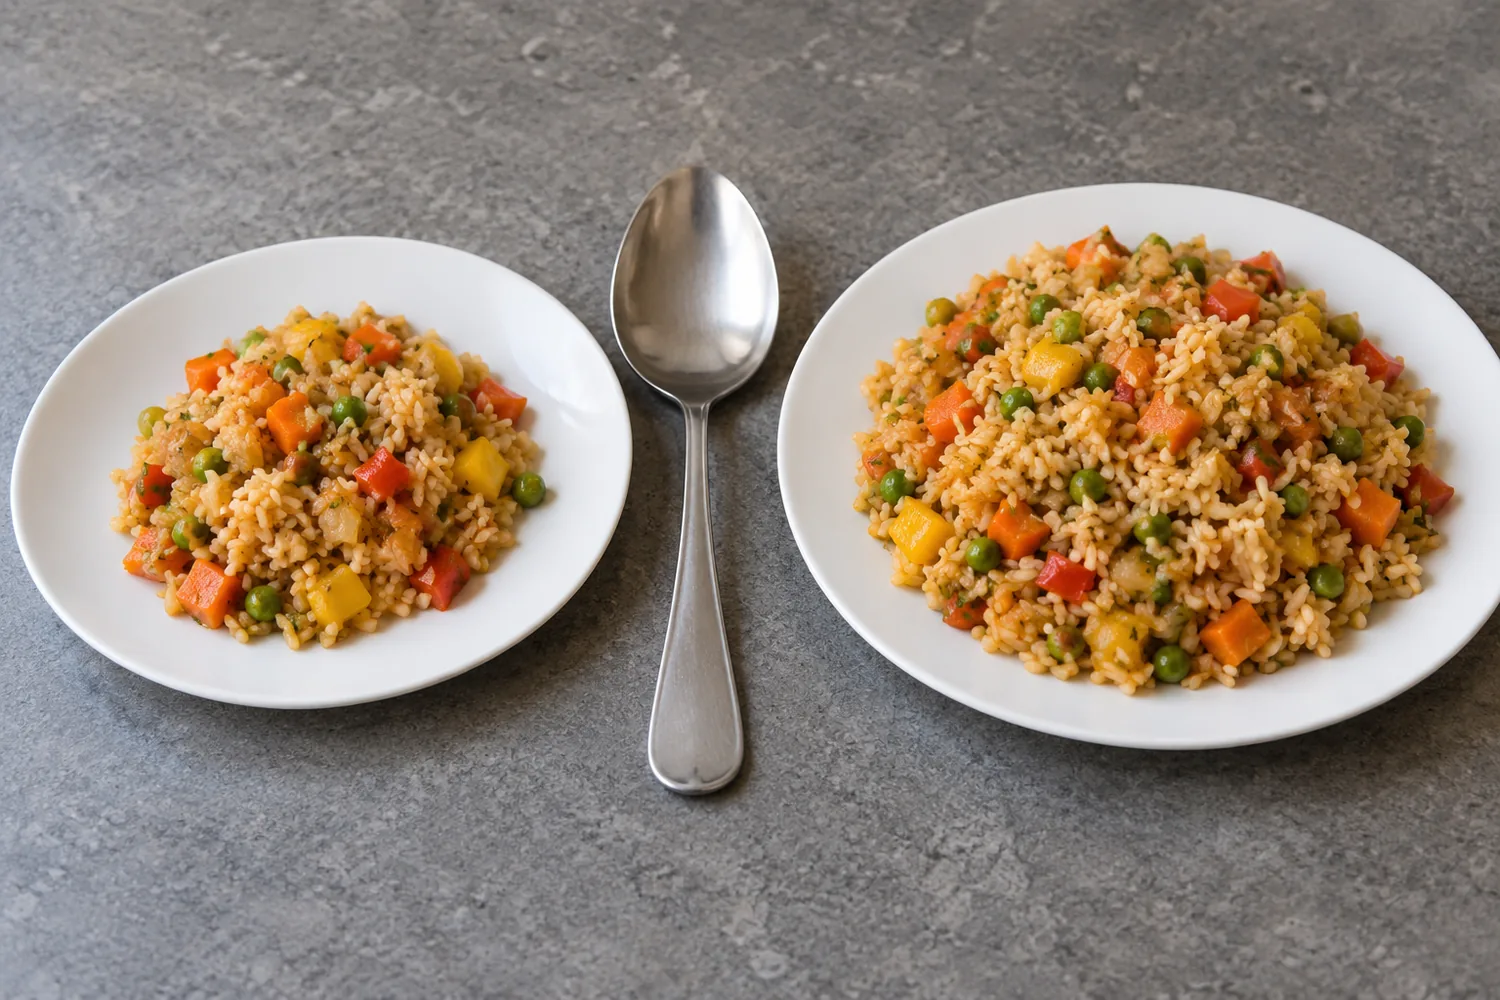
Before featuring either dish, compare how much contribution it generates at the observed demand, whether its usable yield is stable, and whether its preparation creates a service bottleneck. For menu presentation, the cocktail menu design guide shows how consistent entries make choices easier to compare; apply the same consistency to food descriptions and modifiers.
When should a yield change trigger recosting?
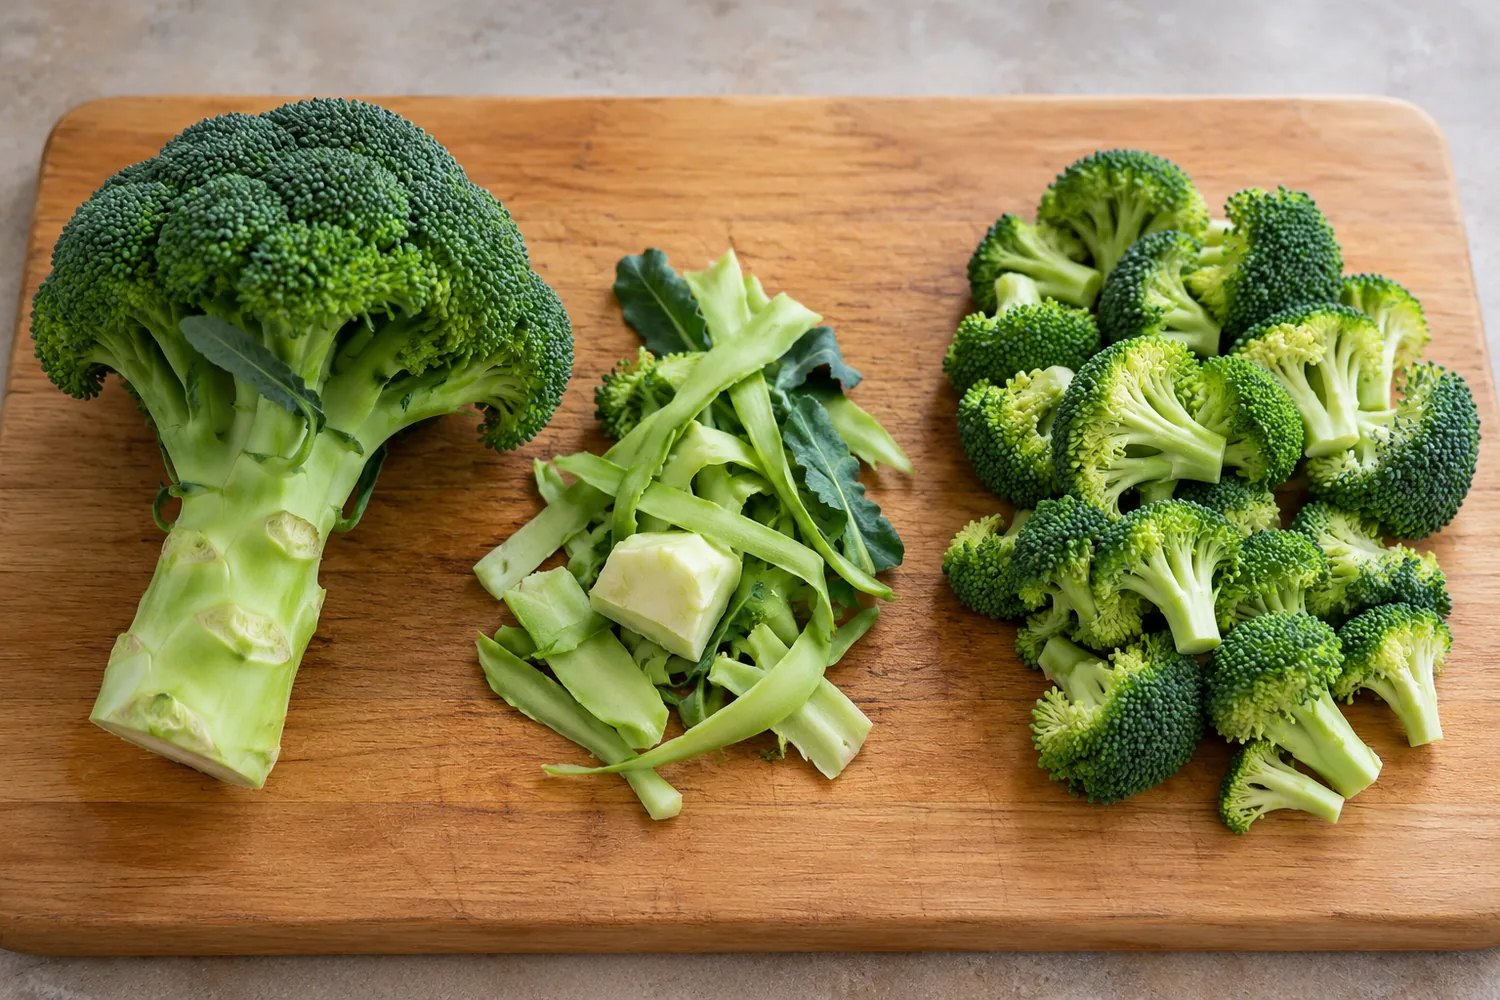
Recost when the usable batch can no longer supply the portions assumed by the recipe. A low supplier cost per unit is unhelpful if the usable output falls short of the planned portion mass.
Rules-of-Thumb — assumed portion plan: If usable batch mass M < 1.6 kg after the defined preparation steps, under an assumed plan of eight portions at 200 g each → choose a new batch-cost calculation or revise the portion plan, because that output cannot supply all eight specified portions.
Required usable batch mass = portions × portion mass = 8 × 200 g = 1,600 g = 1.6 kg, using those assumptions. This is a mass-balance boundary, not a recommended portion size or food-safety threshold. Record why the yield changed before replacing the cost on every recipe that uses the batch.
How do you choose a target and keep costs current?
Choose the target from the operation’s budget, then check whether the resulting menu can cover the remaining costs. The National Restaurant Association explicitly says its operating-ratio data are management tools, not standards or goals for an individual restaurant. (Restaurant operators kept food cost ratios in check in 2024, accessed October 19, 2026.)
For a chosen ingredient ratio, candidate net selling amount = portion ingredient cost ÷ target ratio as a decimal. Under an assumed target of 30%, the earlier portion gives $4.20 ÷ 0.30 = $14.00. That establishes the assumed ingredient ratio; demand and the rest of the cost structure still need evaluation.
Keep a short cost lifecycle record:
| Trigger | Update or reconcile | Cost that can otherwise disappear |
|---|---|---|
| Invoice or ingredient change | Purchase unit and recipe ingredient cost | Unnoticed purchase-cost movement |
| Yield or portion change | Usable output and portions per batch | Trim, preparation loss and overportioning |
| Stock count | Actual usage against recipe-based usage | Waste, count errors and unexplained depletion |
| Channel or packaging change | Order contribution after the relevant operating deductions | Lids, liners, packing labor, fees and remakes |
Carry the ingredient figure into the delivery menu pricing worksheet when evaluating pickup or delivery. That worksheet combines food and labor in its F input, so add the relevant labor amount before transferring the figure. Subtract each packaging or channel cost once; food contribution remains an intermediate amount. Continue reviewing related recipes under menu planning whenever a shared ingredient changes.
Method and sources
The formula and menu-analysis distinctions draw on the BC Cook Articulation Committee’s openly licensed chapter; the stock reconciliation uses AccountingCoach’s inventory identity. The National Restaurant Association supplies the limitation on treating survey data as targets. All were accessed October 19, 2026, and each supports only its cited statement. The examples use explicitly assumed ingredient costs, sales and physical yields; the comparison and lifecycle checks are applications of that arithmetic. No example represents an actual restaurant’s prices or performance.
Updated October 2026.